Find Resources That Present Data On How Different Soccer Positions Run During a Match
This page will share resources and briefly present example conclusions about the distance and type of running different soccer positions experience while playing in a match.
Web Resources to Research Different Positions' Distances Ran During a 90 Minute Match.
One: FIFA Training Centre - Physical Analysis - "What" distances did various positions cover?

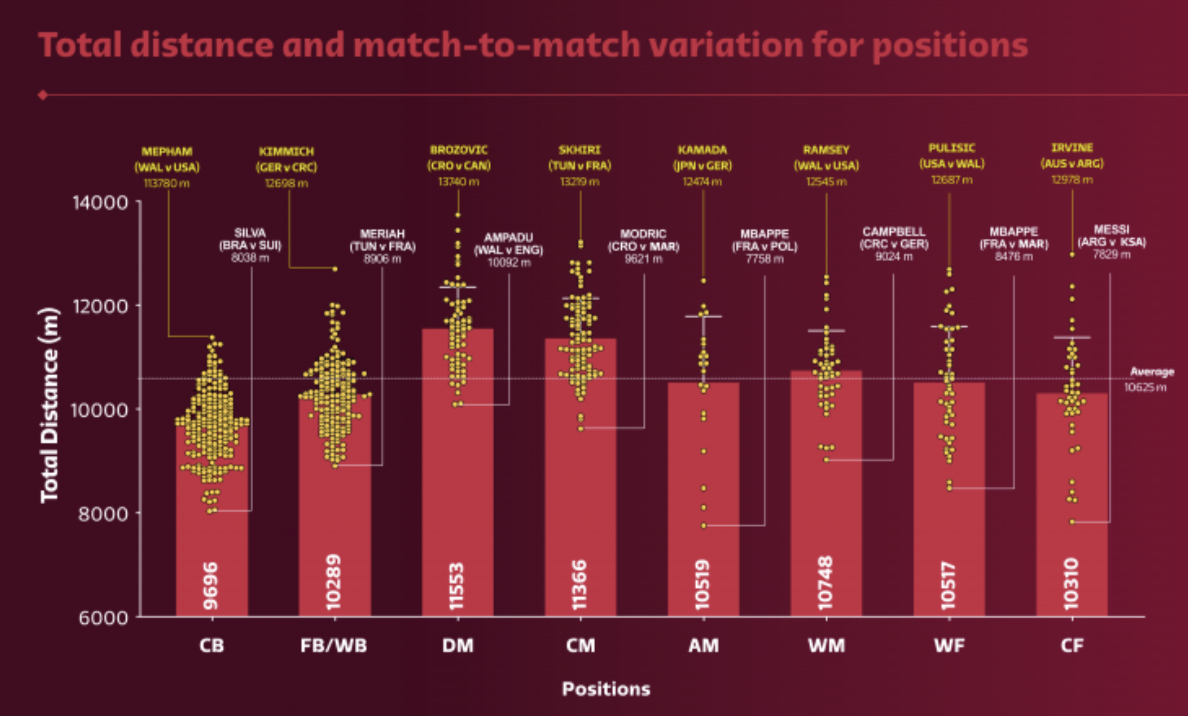
The article “What Distances Did Various Positions Cover,” by Dr Paul Bradley explores the difference in physicality demands required for different soccer positions. He identifies the distances specific positions ran, both in low and high intensity. His results prove that while some positions run extremely high amounts, others run shorter distances but with a higher intensity. If you are interested in understanding how different positions are expected to run during a soccer match, this article will provide a great amount of specific, data driven information presented through helpful and easy to read graphics.
Two: ResearchGate - Physical Analysis - Total Distances Covered by Different Positions

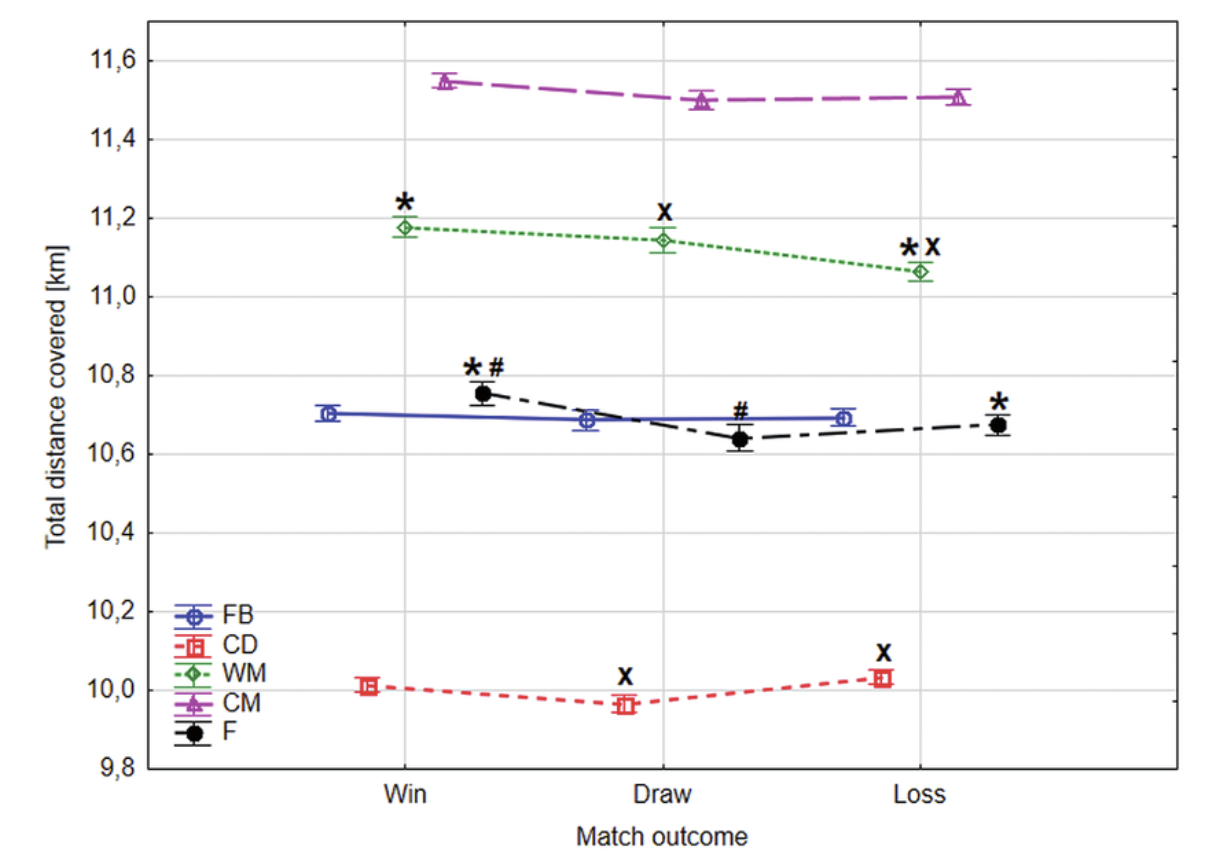
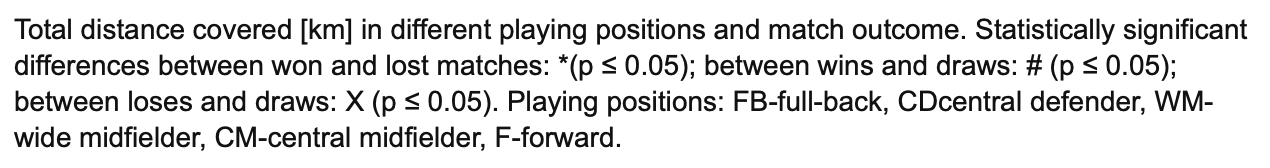
The article from Research Gate (Total Distances Covered by Different Positions) presents a graph showing the different distances run by specific positions when a team wins, loses, and draws. From this data, it is simple to see the correlation between distance run by a certain position and a team’s success. If you are interested in understanding how physicality outputs by position can affect a match’s result, this article will be extremely helpful.
Three: football-observatory - Analysis of the distances covered in professional football competitions

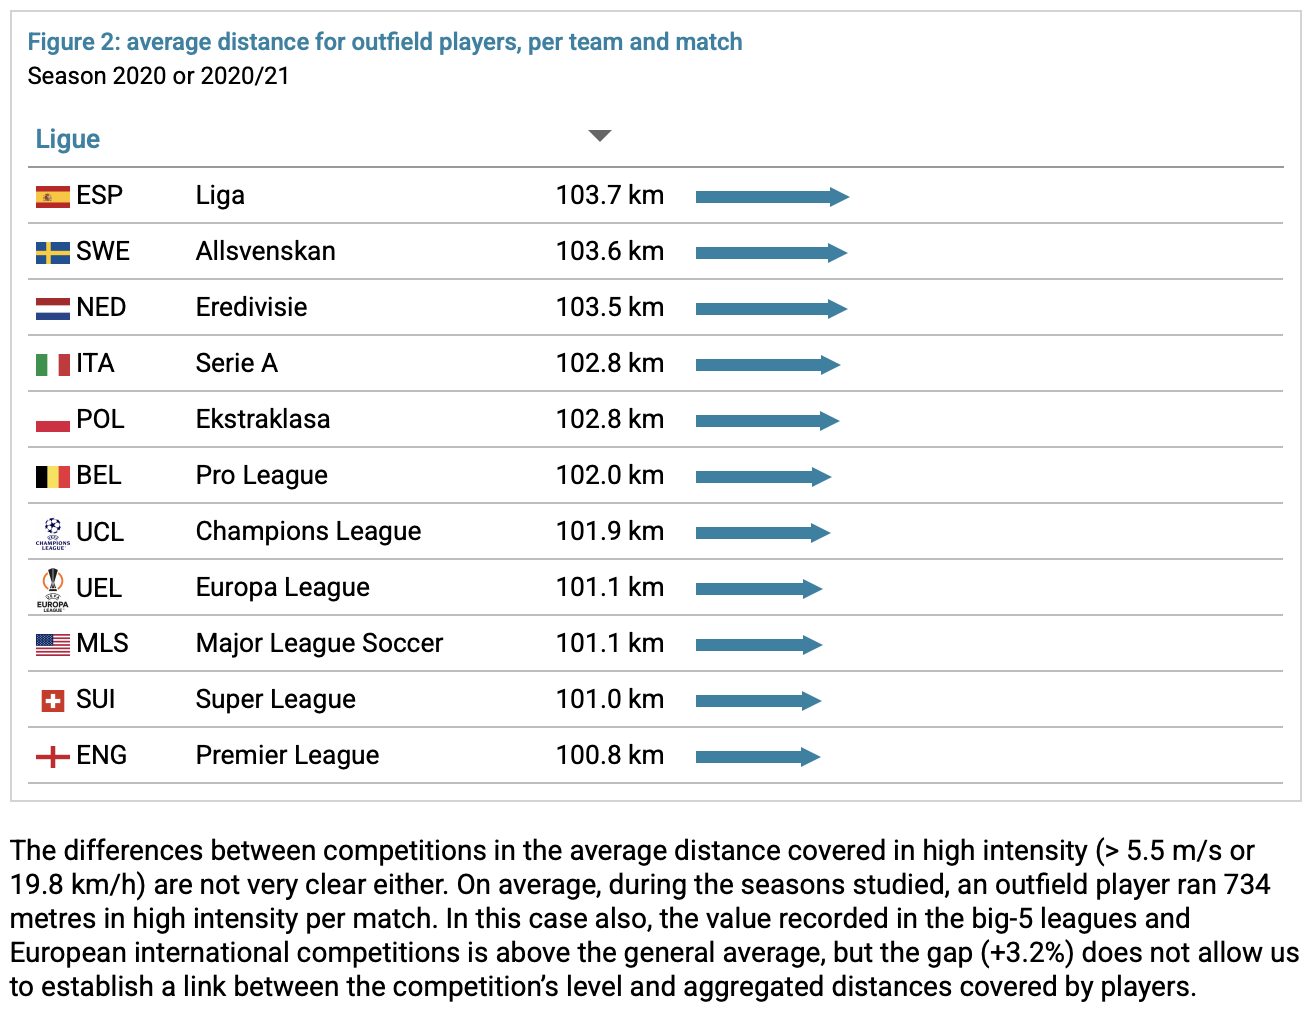
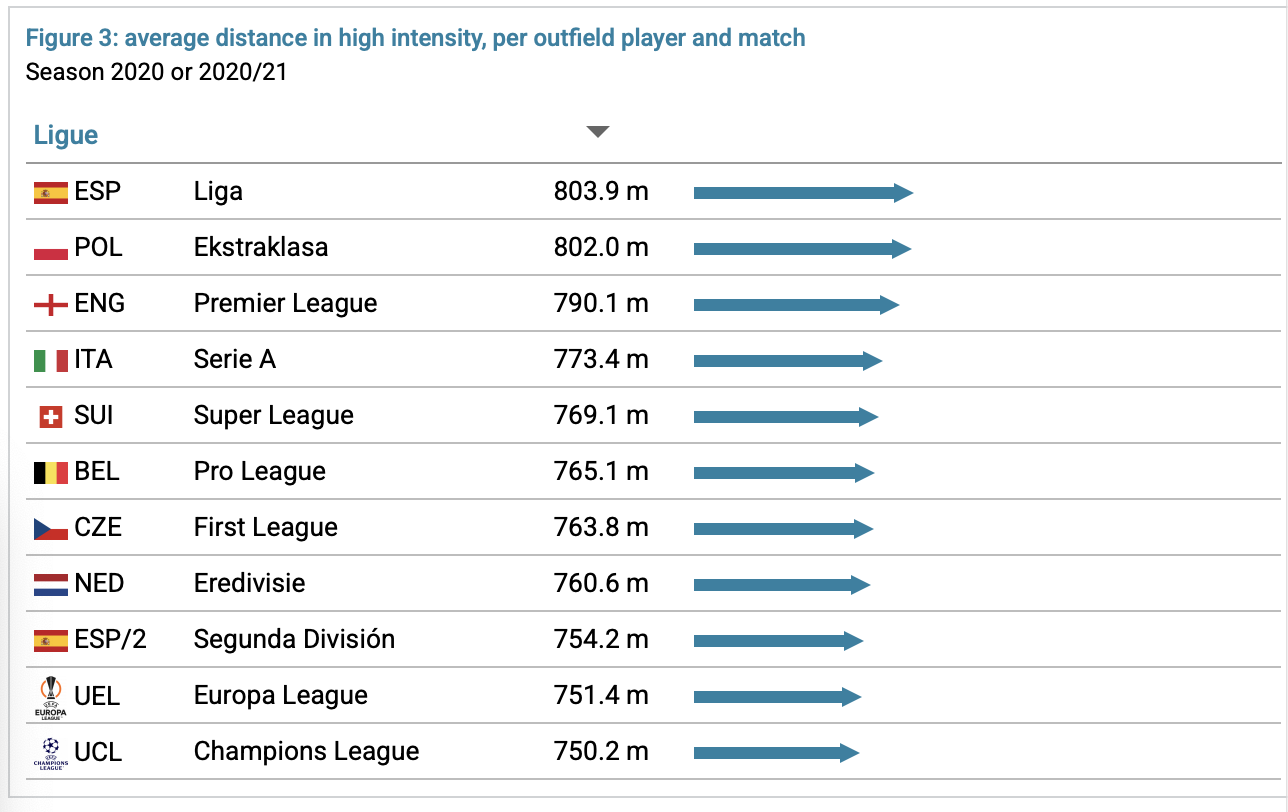
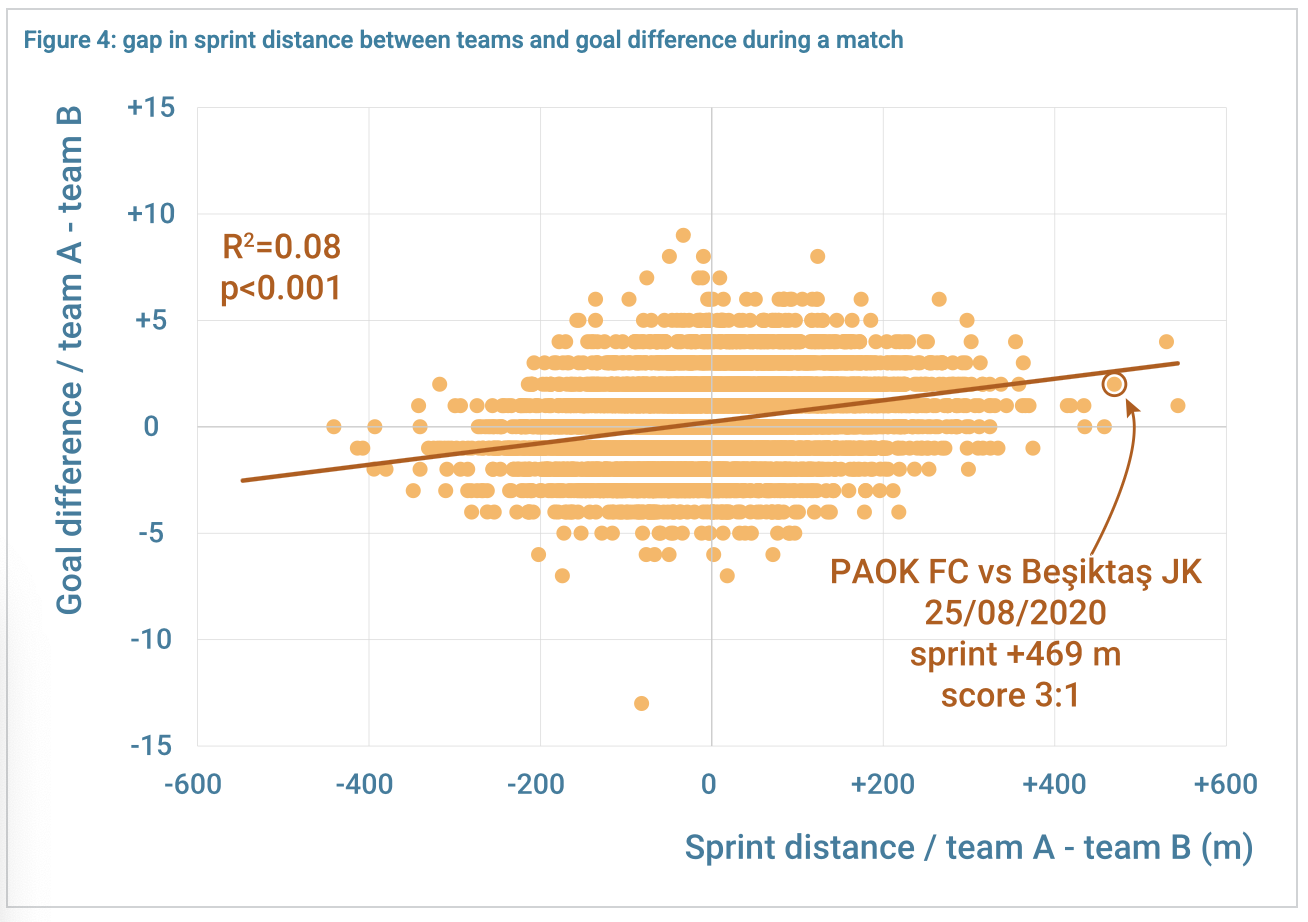
Finally, Football Observatory’s “Analysis of the distances covered in professional football competitions” displays lists showing how different nations’ soccer teams compare regarding specific running statistics, including average distance run for outfield players, average distances covered in high intensity running, and gaps in sprint distances between teams and goal differences during a match. The data published in this article would be extremely useful if you are trying to understand how different nations’ soccer teams run differently, regarding both distance and intensity.
Here are examples of how insights and knowledge can be extracted from raw data and graphs.
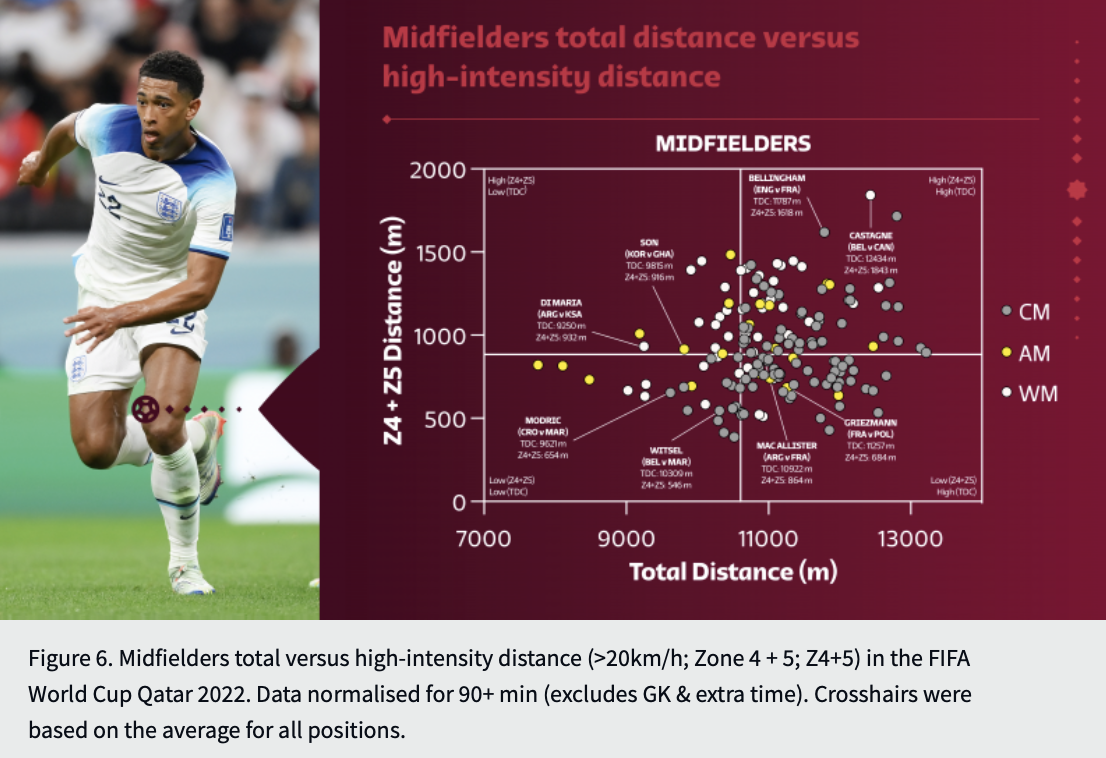
From this image, it is clear that Midfielders (DM and CM most likely do the most long distance running in training, as their position is able to, and expected to, cover the most distance running in an official match. And because players in wide positions cover the most distance at a high intensity in matches, they most likely train explosive speed, and run at high intensity for shorter distances during training. Center Backs are most likely not taking part in extreme conditioning training during practices, as their position does not run very much during a game compared to other positions.
This image presents data showing that a team is more likely to win when Center Midfielders and Wide Midfielders run greater than their average distance. When these same positions run relatively less compared to the distance they ran during a won game, draws and losses are more common. Fullbacks' (FB) distance ran remains very consistent over wins, draws, and losses. Contrary to CMs and WMs, Center Backs (CB) usually run a greater distance during a loss than a win or draw.