Charts & Analysis
Chart 1
PPM Ranking
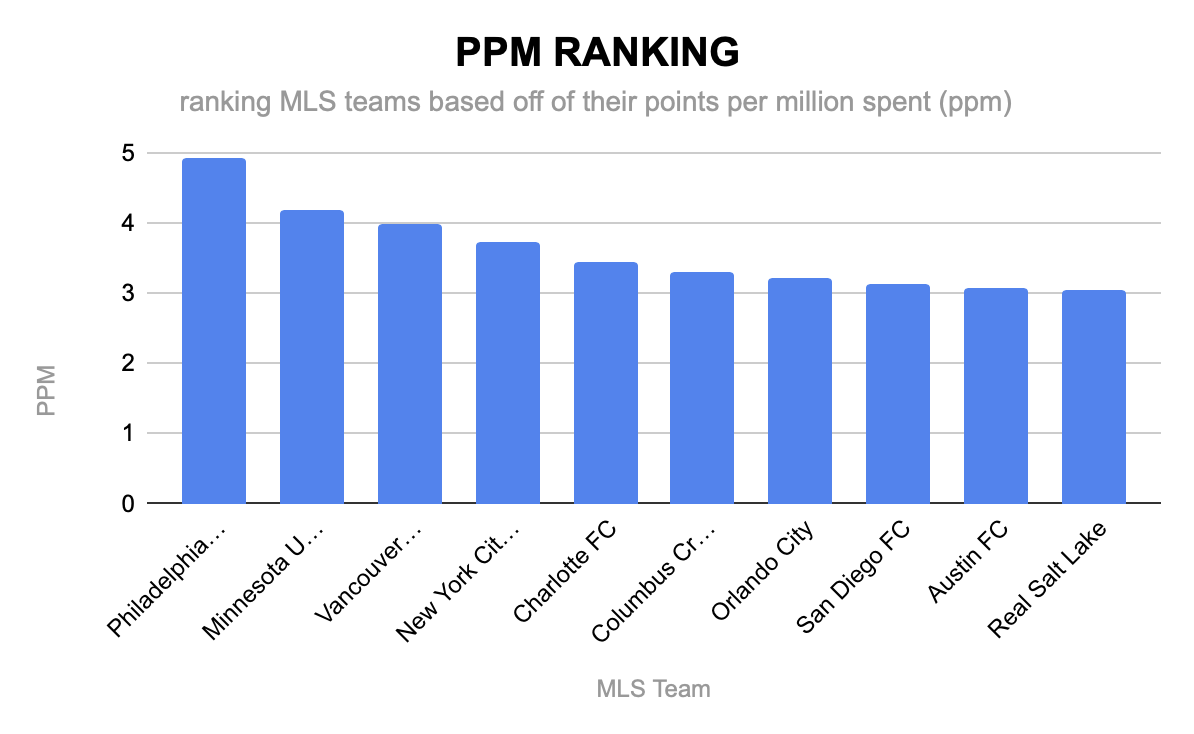
Philadelphia Union had the best PPM at 4.94, which means they got the most points out of every million dollars they spent. The rest of the teams are pretty close together, which shows that spending more does not automatically mean earning more points.
Chart 2
Points Earned vs. Payroll Spent by Team
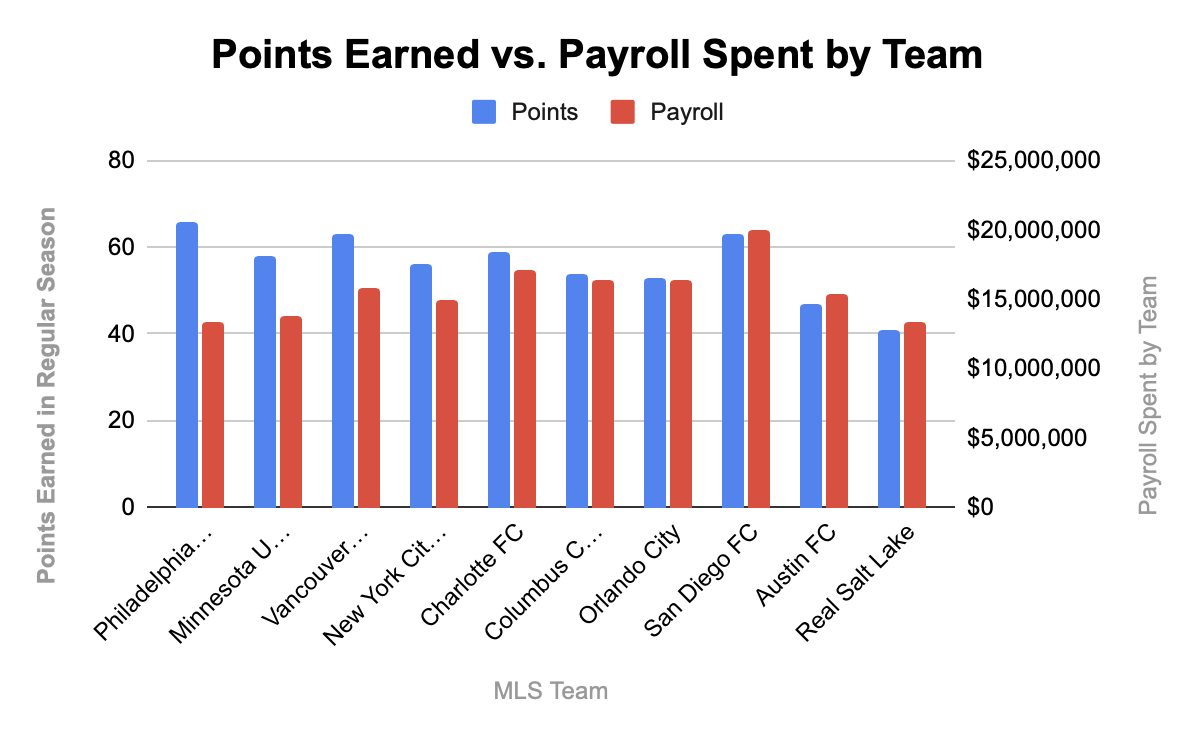
Philadelphia had a low payroll and still earned the most points. San Diego FC spent the most money of any team but only finished in the middle of the pack. This chart makes it easy to see which teams got good value and which ones did not.
Chart 3
Payroll vs. Points (Scatter)
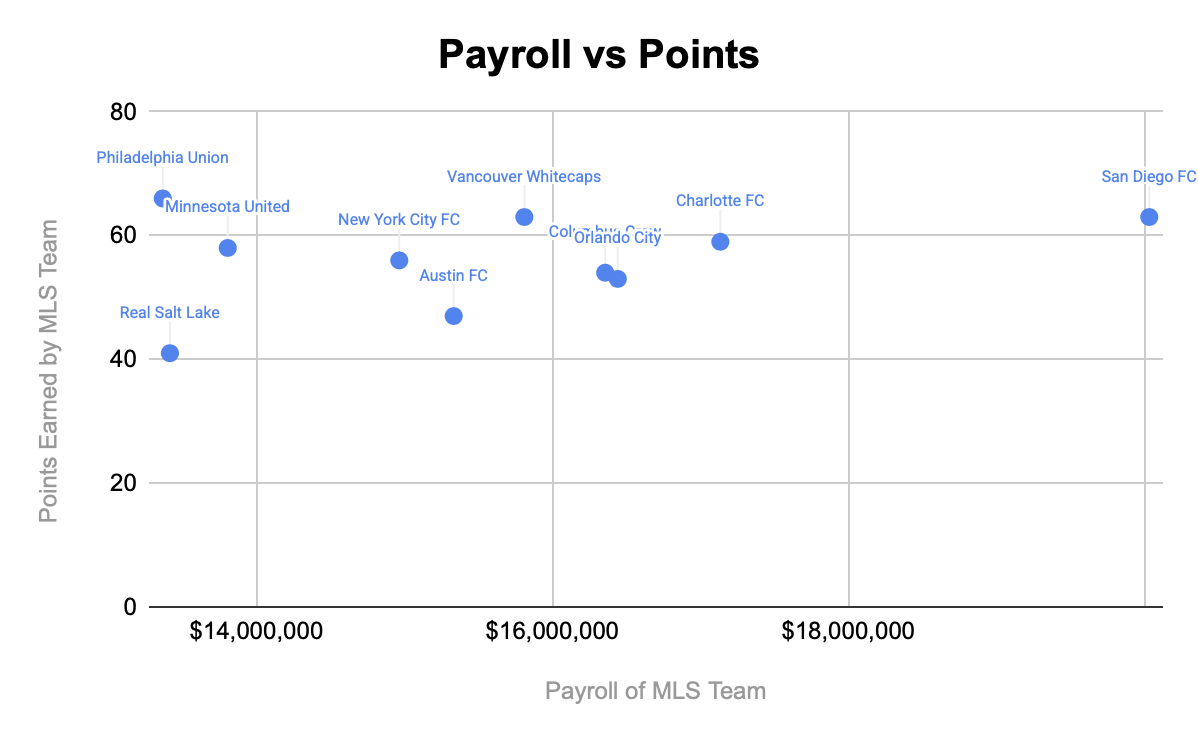
This chart shows that there is no clear pattern between payroll and points. San Diego spent $20 million and got 63 points, while Vancouver spent about $5 million less and got the same result. Higher spending does not mean more points.